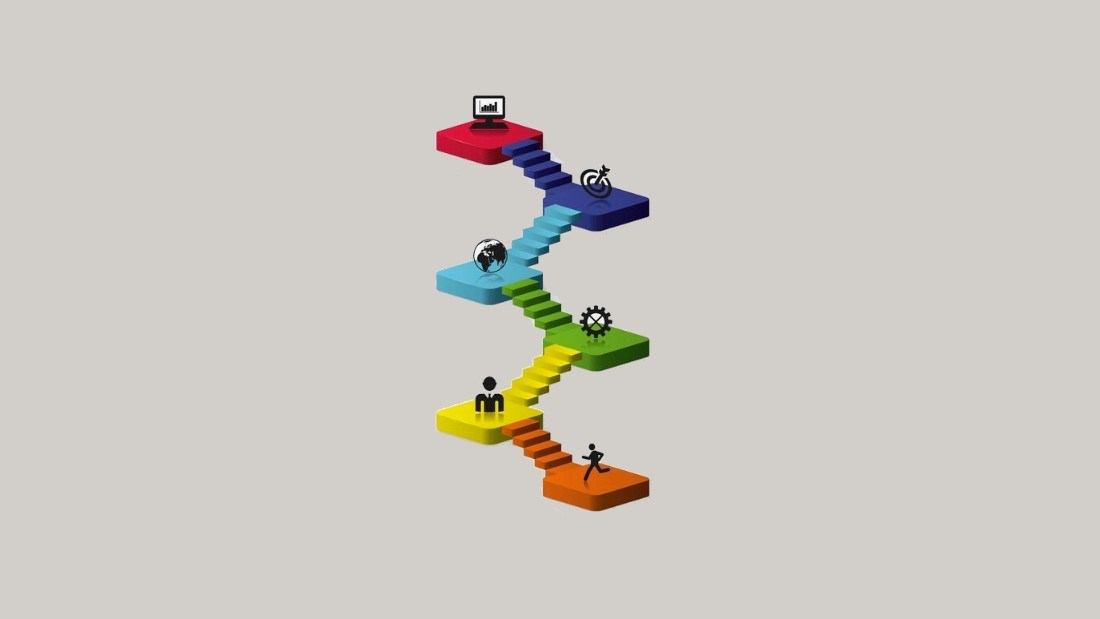
The Anatomy of Infographics

We’re willing to bet that at some point in your internet browsing, you’ve probably seen an infographic or two.
One of the top five most frequently used types of content marketing, infographics have increased in popularity over the last few years, and it’s no wonder why. Humans are visual creatures. We’re much more likely to pay attention to or take action after seeing an image than we are if we had just seen the text.
Infographics are also an excellent way to translate complicated data into something easily digestible for nearly everyone. And it is for this reason they can be an integral part of any good digital marketing strategy.
So What is an Infographic?
Exactly what it sounds like - an informational graphic! It’s a way for companies to take contextually relevant information and present it to their customers in a visual format. Infographics can make even the most boring data seem bright and exciting.
When we create an infographic for one of our clients, our content development team starts by researching which topics will return the best results. Next, we conduct research and gather data based on the chosen topic, and distill the information into easy-to-understand content. From there, it heads off to our graphic designers, who craft a visually stunning piece using beautiful graphics that act as the perfect accompaniment to our content. From there, the infographic is ready to go out into the world!
What are the Different Types of Infographics?
Infographics can be used to represent everything from complex studies and reports to lists and step by step instructions. The most commonly used infographics are:
- Lists of things like tips and or popular products
- Timelines that chronologically document events, history, or even processes
- Comparative infographics that contrast two or more items
- Data visualizations that incorporate graphs and/or charts
- Anatomic infographics that can diagram even the most complex topics or products
What are the Benefits of Infographics?
We’re glad you asked! The number one benefit of using infographics as part of your marketing strategy is to convey valuable information to your customers. Additionally, infographics have a lot of functions, like:
- Helping you reach your target demographic(s)
- Informing your customers how your products or services can help them
- Showing your customers you understand them
- Creating an emotional connection with your customers
- Helping your customers solve their problems via useful info
- Increasing engagement on social media and your website
- Getting your content in front of influencers and businesses who may share it with their customers
- Enhancing your blog
- Improving SEO
- Helping you refine your brand voice

How Do You Make the Perfect Infographic?
Above all else, infographics must have a clear and impactful design to convey relevant and factual information. More specifically, there are plenty of tips to help ensure one is creating the best infographic possible:
Use bright colors, but keep it simple. You don’t need the whole rainbow. Sticking to five or so colors should work just fine.
Don’t go font crazy. Only use easy to read fonts. There’s no need to get fancy with fonts!
Carefully create your layout to ensure it’s not too crowded and includes the right amount of blank space.
Use subtle calls to action. Remember, you’re trying to earn business by providing useful info. Using CTAs sparingly will prevent your infographics from feeling too salesy.
Incorporate illustrations and icons, but only enough to complement the content. Minimal designs tend to be the most effective.
Condense your data as much as you can to make it easier to digest.
Use high-quality imagery. This is not the time for dark, blurry, or pixelated images!
If it’s not relevant, leave it out. Again, keep it simple, informational, and effective.
Check your grammar and spelling, and then check them again. And… maybe check them once more afterward.
Lastly, don’t forget those alt-text descriptions. They serve to help your SEO and users with certain disabilities.
Where Do I Share Infographics?
Infographics are great because they can be displayed pretty much anywhere. Want to enhance one of your website's service pages? Add an infographic. Need some content to share on social media? Post a new infographic. Trying to beef up your blog posts? Throw an infographic in there!
At BlueTone Media, infographic creation is a standard part of our content marketing strategies. We’ve created infographics for everything from how to avoid bad breath to golf cart road rules to the benefits of solar energy. If your content market strategy needs a little help, an infographic may be just what you need. Reach out to us to discover how we can help your content marketing perform better!

